- August 2, 2022
- Posted by:
- Categories:

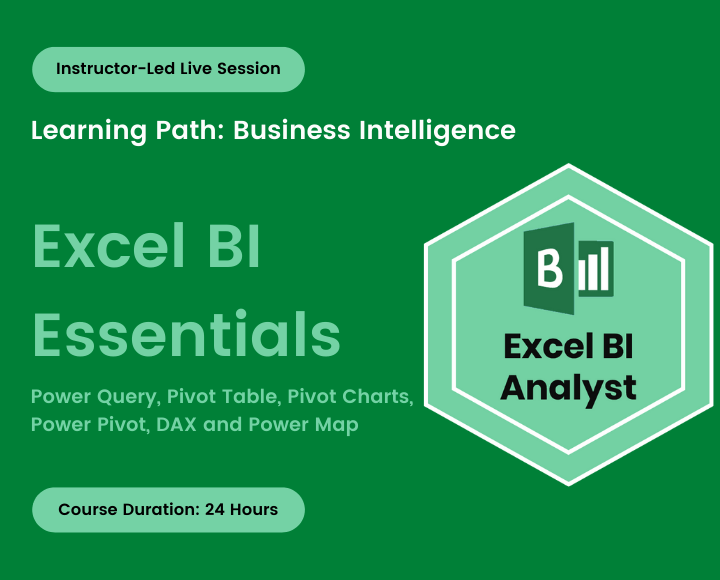
Excel BI Essentials – Power Query, Pivot Tables, Pivot Charts, Power Pivot, DAX, and Power Map
Do you want to change your company’s reporting game forever? This course is for you.
In this hands-on guided training, You will learn how to use Excel BI tools including Power Query, Power Pivot, DAX, and Power 3D Map together to analyze huge amounts of business data fast and transform data into bottom-line results – no programming required!
Together, we’ll walk through the Excel BI workflow, and build robust Self Service BI solutions:
We first look at how to bring data together, clean, reshape, and combine data with ease using Power Query.
Next, we will move on to creating relationships between data tables and building out a data model. We then look at performing simple-to-sophisticated calculations using DAX. You will also explore the powerful features of Excel Power Map, KPI’s and adding key metrics.
Finally, we will create an interactive dashboard, combining all the excel BI tools together.
Throughout the course, we will use many data sets as examples.
What will you learn?
This course sheds light on advanced concepts and topics of data analytics and visualization in Microsoft Excel. You will learn
- How to import data from different sources
- Create mashups between data sources, and prepare data for analysis.
- How business calculations can be expressed using the DAX calculation engine.
- How the data can be visualized and used in dashboards
Additional Details
Discount Available - Yes
