- November 4, 2022
- Posted by: TechTAR Solutions
- Categories: Data Modeling & DAX, Power Pivot and DAX

Hello, everyone!
Have you ever needed to compare monthly billing, customer numbers, products, and so on? If so, you won’t want to miss today’s content, which will cover DAX Time Intelligence functions. There are several functions to help with Month Over Month (MoM) Calculation, and you’ll be surprised at how useful and simple they are to use!
Before I begin, I’d like to highlight two DAX function resources: Official Power BI Documentation and Dax Cheat Sheet.
Description of the Scenario
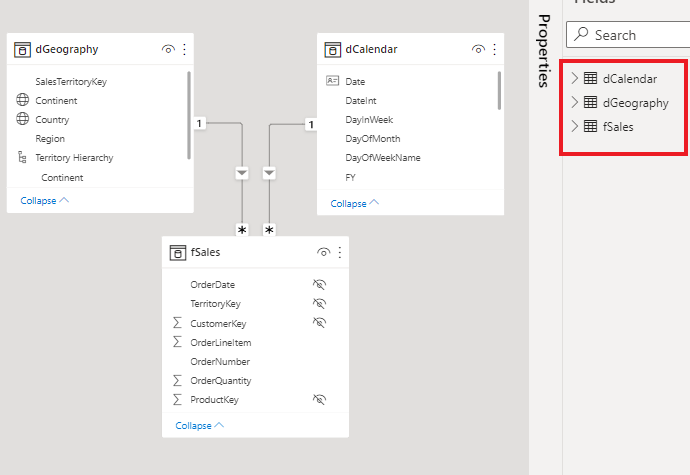
We have the following tables in our scenario: dCalendar, dGeography, fSales
Assume we already have the Total Quantity measure:
Formula: Total Quantity = SUM(fSales[OrderQuantity])
We’ll also choose a matrix visual to help us visualize the measure. The Date field is inserted in the rows of the matrix visual, and the Total Quantity measure is inserted in the column. Take a look at the image below:

Monthly variation (% MoM)
Now we want to figure out how much the Quantity value has changed since last month (month over month). We will use the DATEADD and PREVIOUSMONTH DAX Functions to complete this task.
1. Last Month with DATEADD
When creating a DAX measure, keep in mind that all of the values it employs must be visible in the context. This means that if we want to calculate the monthly variation, we must bring the values from the previous month to the same line (context) where we are calculating this variation. First and foremost, we must bring that past value into the ‘present’ context. We’ll use the DATEADD function as follows:
DATEADD: It’s great for calculating percentage growth over time. It is used to move backward or forward in time (years, quarter, months, days).
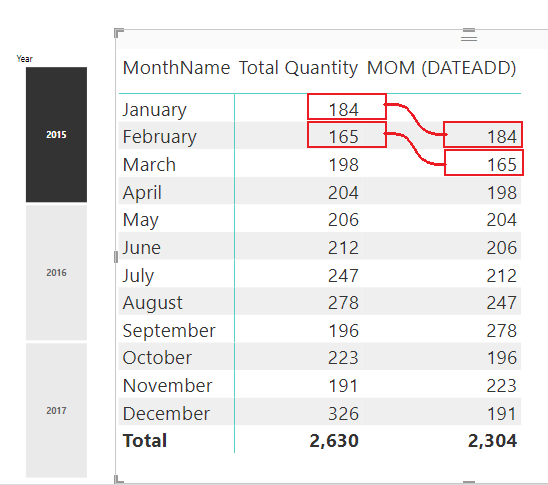
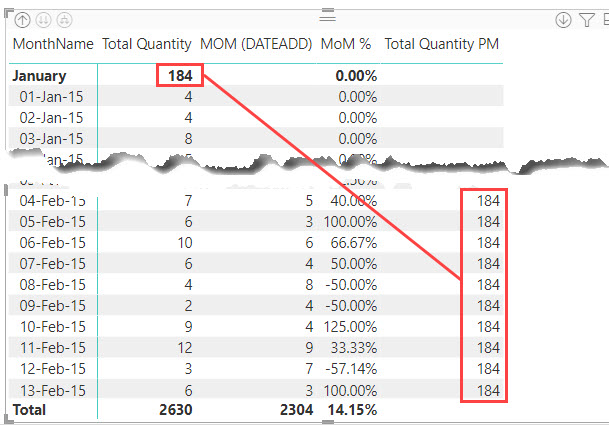
In the image above, the Total Quantity for January has been moved to the line for February (we moved back 1 month in context), and the Total Quantity for February has been moved to the line for March in the column MoM (DATEADD).
Remember that DATEADD takes into account the entire context or period (in this example, the month)
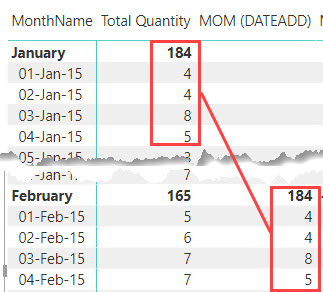
As you can see, MOM (DATEADD) produced the value Total Quantity on February 1, 2, 3, 4, and 5. (1 month back exactly).
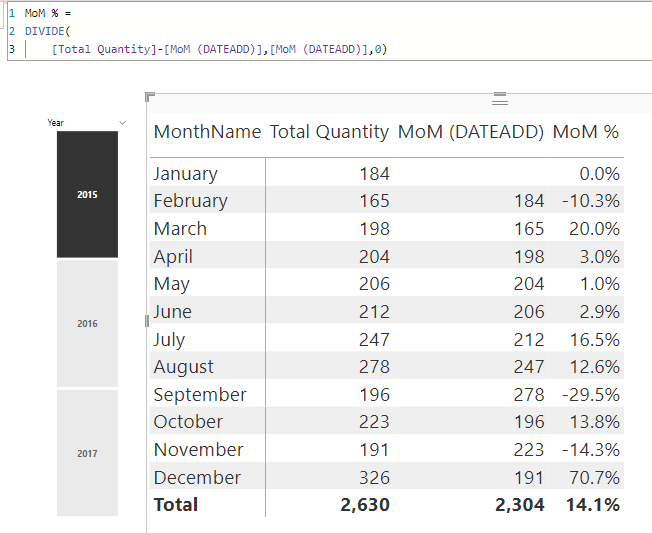
2. % MoM using DIVIDE
Let’s calculate the monthly variation using the DIVIDE function (month over month). To determine the variation, we must first compute the difference between the two values and then divide that difference by the last one. Examine the syntax below
Formula:
3. Last Month with PREVIOUSMONTH
We could use the PREVIOUSMONTH function to repeat the value of Total Quantity for January on each line (day) of the following (February) month. Check the syntax:
Wrap-up
So, that’s it for today’s content; I hope you found it useful!