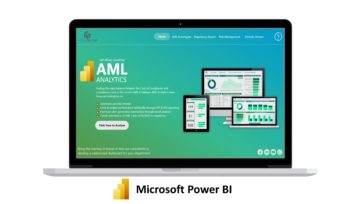
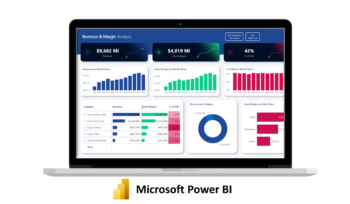
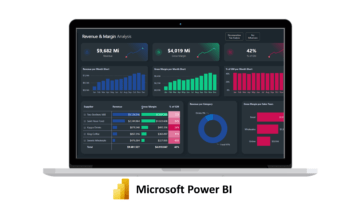
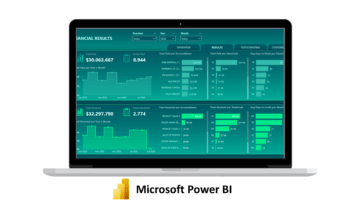
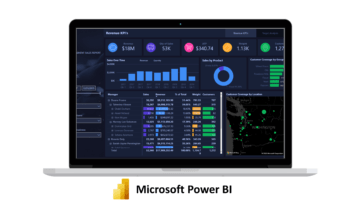
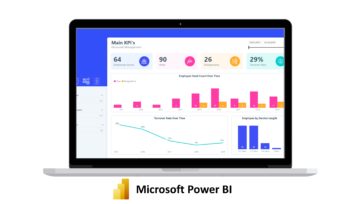
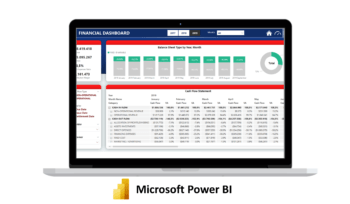
Story-Driven Dashboard Examples AML Analytics AML Analytics is a visual interactive reporting application that is designed to “Measure something that appears unmeasurable.” VIEW LIVE DEMO Revenue & Margin Analysis Showcase territory analysis of companies’ sales. Drill into product insights to estimate future revenue opportunities. (Light Version) VIEW LIVE DEMO Revenue & Margin Analysis Showcase territory analysis of companies’ sales. Drill into product insights to estimate future revenue opportunities. (Dark Version) VIEW LIVE DEMO Income Statement Review key financial results on the landing page. Drill down metrics into key dimensions for further insights. VIEW LIVE DEMO Sales vs Target Analyze revenue and compare it with the target set by What if Analysis. Adjust pre-set time frames to have visuals automatically updated. VIEW LIVE DEMO Human Resource Report on HR KPIs along with each employee profile. Useful to attract, manage, and retain employees, which improves ROI. VIEW LIVE DEMO Financial Cash Flow Review key financial information with summarized CashFlow. Drill into key dimensions for insights by monthly and accumulated values. VIEW LIVE DEMO Get Microsoft and Data Analytics news, events, tutorial, and exclusive offer in your inbox SUBSCRIBE